Your Claude Code is slow.
Here's why.
Stop guessing why Claude Code is eating your CPU. Get instant visibility into every Claude process—CPU spikes, memory leaks, orphaned processes—all in your menu bar.
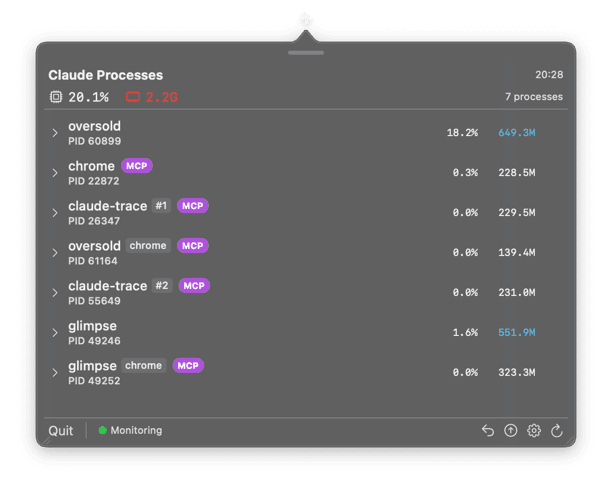
See All Sessions at a Glance
A native macOS app that lives in your menu bar. Always watching, never in the way.
A native macOS app that lives in your menu bar. Always watching, never in the way.
Features
Everything you need to debug Claude
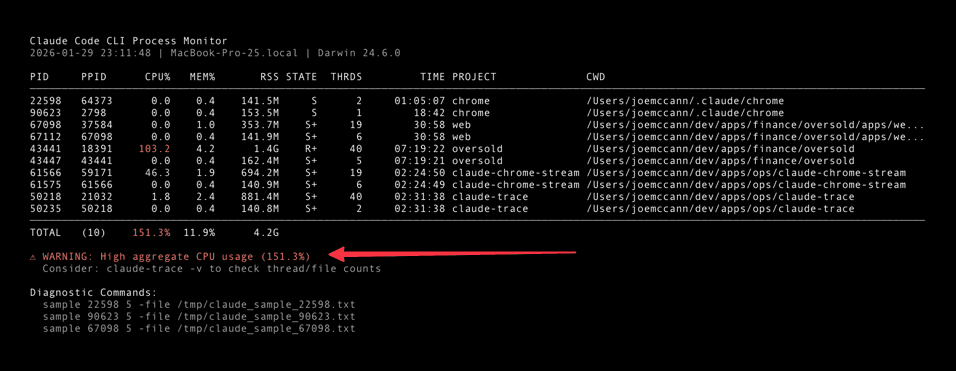
Claude Code runs multiple Node.js processes. Sometimes they spin. Sometimes they leak. Claude Trace makes the invisible visible.
Live CPU & Memory
Real-time stats for every Claude session. See exactly where your resources are going.
Project Names
Know which project each Claude session belongs to. No more guessing.
Native Notifications
Get alerted before your fans spin up. Set custom thresholds that match your workflow.
One-Click Kill
Stop runaway processes instantly. No terminal needed.
Orphan Detection
Find and clean up zombie Claude sessions that are wasting resources.
Launch at Login
Set it and forget it. Claude Trace starts automatically with macOS.
Command Line
Power user interface
For quick checks without opening the app. Perfect for scripting and automation.
$ claude-traceSee all Claude processes
$ claude-trace -wWatch mode — live updates every 2 seconds
$ claude-trace -vVerbose — includes project name and working directory
$ claude-trace -j | jq '.totals.cpu_percent'JSON output for scripting
Or build from source — includes CLI and menu bar app
git clone https://github.com/joemccann/claude-trace.git && cd claude-trace && ./dev.sh deployRequires macOS 14.0+ and Xcode 15.0+